
-
PERFECTING THE AIR TOP
Through Perfecting the Air, Daikin strives to make the world’s spaces happier and more comfortable.


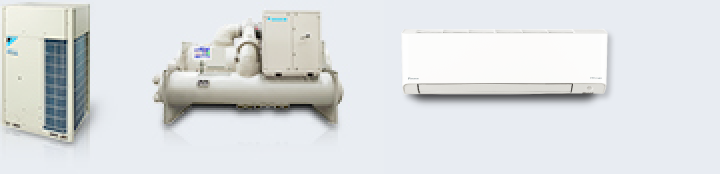
- Air Conditioning & Refrigeration
Daikin leverages its experience and technology to deliver air conditioning solutions that meet the demands of any setting.
- Products

Financial Data
As of 9 May, 2024
| Unit | FY2019 | FY2020 | FY2021 | FY2022 | FY2023 | FY2024 (Forecast) |
|
|---|---|---|---|---|---|---|---|
| Net Sales | billion yen | 2,550.3 | 2,493.4 | 3,109.1 | 3,981.6 | 4,395.3 | 4,540.0 |
| Operating Profit | billion yen | 265.5 | 238.6 | 316.4 | 377.0 | 392.1 | 425.0 |
| Ordinary Profit | billion yen | 269.0 | 240.2 | 327.5 | 366.2 | 354.5 | 390.0 |
| Profit Attributable to Owners of Parent | billion yen | 170.7 | 156.2 | 217.7 | 257.8 | 260.3 | 267.0 |
| Earnings Per Share | yen | 583.61 | 533.97 | 743.88 | 880.59 | 889.22 | 912.01 |
| Overseas Business Ratio | % | 77 | 77 | 79 | 83 | 84 | - |
| Free Cash Flow | billion yen | 125.6 | 123.5 | -13.4 | -202.7 | 165.6 | - |
| Return on Assets | % | 6.4 | 5.3 | 6.2 | 6.3 | 5.4 | - |
| Return on Equity | % | 12.0 | 10.1 | 12.0 | 12.3 | 10.7 | - |
| Shareholders' Equity Ratio | % | 53.8 | 51.4 | 51.5 | 51.9 | 54.0 | - |
| Plant-and-Equipment Investment | billion yen | 132.0 | 137.0 | 156.3 | 250.3 | 311.5 | - |
| Research & Development Costs | billion yen | 68.0 | 71.7 | 81.5 | 102.2 | 122.5 | - |
| Liability with Interest Ratio | % | 20.8 | 23.2 | 21.6 | 20.6 | 19.8 | - |
| Employees | person | 80,369 | 84,870 | 88,698 | 96,337 | 98,162 | - |
Financial Data _ Fiscal Year Ended March 31, 2023(394KB)
WE RECOMMEND
Find out more in your region.
